Я думаю, все знакомы с типом отчета Auction insights в Google Ads.
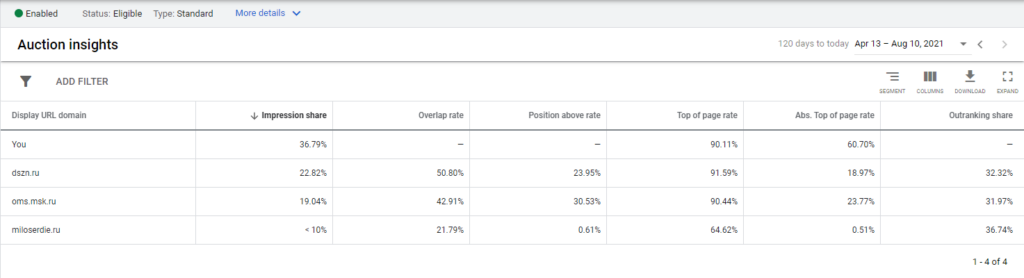
На протяжении многих лет это выглядело очень бедно и давало лишь общее представление о том, в каком положении вы находитесь по отношению к конкурентам.
Важно помнить, что отчет относителен. В нем отображаются данные с аукционов, в которых вы участвовали. Если по какой-либо причине ваше объявление было остановлено и вы не боролись за показ, то данные об этих аукционах не будут включены в ваш отчет.
Однако некоторое время назад Google добавила возможность просмотра данных Auction insights в стандартном построителе отчетов. И оказалось, что там гораздо больше данных:
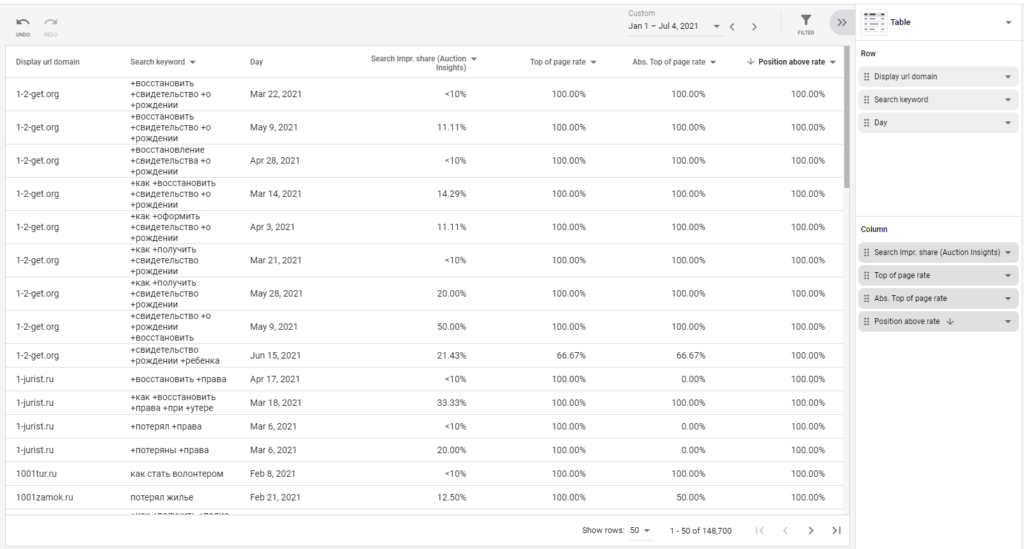
Сейчас у нас много данных, но работать с такой таблицей не очень удобно. Нужно организовать хранение данных, строить по ним отчеты и обновлять их. Я решил сделать это в Google Data Studio.
К сожалению, отчет не может быть загружен через API, поэтому я написал скрипт в Google Apps, который обновит данные в отчете.
Сбор данных
На Google Диске создана общая папка. Любой из менеджеров трафика, имеющий доступ к отчету и папке, может загрузить csv-файл отчета в интерфейсе Google Ads и загрузить его в эту общую папку. Скрипт проверяет папку раз в час и, если находит в ней файл отчета, загружает его в Google BigQuery.
Вы не сможете загрузить файл напрямую.Вам необходимо преобразовать его в правильный формат. Вот функция обработки файла:
function main() {
    var date = Utilities.formatDate(new Date(), 'GMT', 'yyyyMMdd');

    // folder for reports
    var folderCSV = DriveApp.getFolderById('*********************************');
    var files = folderCSV.getFilesByType(MimeType.CSV);
    while (files.hasNext()) {
        var file = files.next();
        var filename = file.getName();

        // processed files will be renamed and deleted, this is a filter so as not to get confused
        if (filename.indexOf('__') == -1) {
            var data = file.getBlob().getDataAsString();
            var arr = Utilities.parseCsv(data);
            arr.splice(0, 3);

            // cut headings and log the number of lines
            Logger.log(arr.length);
            var uniqueArr = [];
            for (var i = 0; i < arr.length; i++) {
                uniqueArr.push([arr[i][1], 0]);
            }
            uniqueArr = unique(uniqueArr);
            var filterArr = [];

            // and counted the number of unique domains in the report
            Logger.log(uniqueArr.length);
            for (var d = 0; d < uniqueArr.length; d++) {
                var line = uniqueArr[d];
                for (var l = 0; l < arr.length; l++) {
                    if (uniqueArr[d][0] == arr[l][1]) {
                        line[1] = +line[1] + +1;
                    }
                }

                // in BigQuery, we will add data only for domains that appear in the report more than 100 times
                if (line[1] >= 100) {
                    filterArr.push(line[0]);
                }
            }
            var filteredArr = [];
            for (var f = 0; f < filterArr.length; f++) {
                for (var l = 0; l < arr.length; l++) {
                    if (filterArr[f] == arr[l][1]) {
                        try {

                            // everything is beautifully formatted and put into an array
                            arr[l][2] = Utilities.formatDate(new Date(arr[l][2]), "GMT", "yyyy-MM-dd'T'HH:mm:ss'Z'");
                            arr[l][3] = arr[l][3].replace(/\%/i, '').replace(/<10/i, '1');
                            arr[l][4] = arr[l][4].replace(/\%/i, '');
                            arr[l][5] = arr[l][5].replace(/\%/i, '');
                            arr[l][6] = arr[l][6].trim().replace(/\-\-/i, '0');
                            filteredArr.push(arr[l].join(','));
                        } catch (e) {
                            Logger.log(e);
                        }
                    }
                }
            }

            // Collecting a csv file from the array for uploading to BigQuery
            var newCSVstring = filteredArr.join('\r\n');

            var newFile = folderCSV.createFile('__AU_' + date + '.csv', newCSVstring);
            if (newFile) {
                try {
                    file.setName('___DEL__' + date + '.csv');
                    file.setTrashed(true);
                } catch (e) {
                    Logger.log(e);
                }
                var fileId = newFile.getId();

                // delete the original file, and send the formatted and cleaned file to BigQuery
                loadCsv(fileId);
            }
        } else {
            try {
                file.setName('___DEL__' + date + '.csv');
                file.setTrashed(true);
            } catch (e) {
                Logger.log(e);
            }
        }
        break;
    }
}

function unique(arr) { // remove duplicates
    var tmp = {};
    return arr.filter(function (a) {
        return a in tmp ? 0 : tmp[a] = 1;
    });
}
Для загрузки в BigQuery создадим отдельную функцию. В нем вам нужно будет указать заранее подготовленный проект и набор данных, в котором скрипт будет создавать таблицы с отчетами.
function loadCsv(csvFileId) {
    var projectId = '***********'; // Project name
    var datasetId = '***********'; // dataset name
    var date = Utilities.formatDate(new Date(), 'GMT', 'yyyyMMdd');
    var tableId = 'AU_IS_' + date; // table name
    var table = {
        tableReference: {
            projectId: projectId,
            datasetId: datasetId,
            tableId: tableId
        },
        schema: {
            fields: [{
                    name: 'account', // if you do not have an MCC report, you will not need this field
                    type: 'STRING'
                },
                {
                    name: 'domain',
                    type: 'STRING'
                },
                {
                    name: 'keyword',
                    type: 'STRING'
                },
                {
                    name: 'date',
                    type: 'TIMESTAMP'
                },
                {
                    name: 'search_impr_share',
                    type: 'FLOAT'
                },
                {
                    name: 'top_of_page_rate',
                    type: 'FLOAT'
                },
                {
                    name: 'abs_top_of_page_rate',
                    type: 'FLOAT'
                },
                {
                    name: 'position_above_rate',
                    type: 'FLOAT'
                }
            ]
        }
    };
    table = BigQuery.Tables.insert(table, projectId, datasetId);
    Logger.log('Table created: %s', table.id);

    var file = DriveApp.getFileById(csvFileId);
    var data = file.getBlob().setContentType('application/octet-stream');
    // Create a job to load data
    var job = {
        configuration: {
            load: {
                destinationTable: {
                    projectId: projectId,
                    datasetId: datasetId,
                    tableId: tableId
                },
                skipLeadingRows: 1
            }
        }
    };
    job = BigQuery.Jobs.insert(job, projectId, data);
    Logger.log('Load job started. Check on the status of it here: ' + 'https://bigquery.cloud.google.com/jobs/%s', projectId);
}
Вот и все, функция main() должна быть настроена на запуск каждый час с помощью триггера, и данные из папки автоматически попадут в BigQuery.
Визуализация данных
Я решил визуализировать отчет в Data Studio.
Сначала нам нужно создать источник данных. В списке предлагаемых коннекторов выберите BigQuery, а затем создайте запрос с помощью пользовательского запроса:
SELECT * FROM `project-name.dataset_name.AU_IS_*`Этот запрос соберет данные для отчета из нескольких таблиц, что позволит вам добавлять таблицы с данными «на лету».
Перейдите к настройке полей:
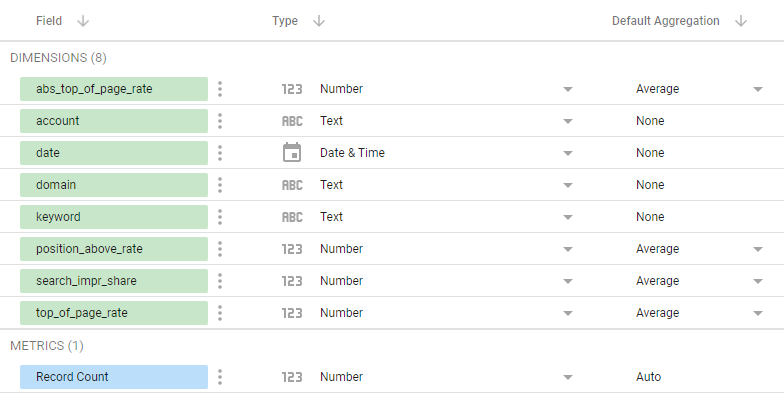
Для полей с параметрами конкурентов мы устанавливаем агрегацию в среднее значение.
И построение отображения отчета:
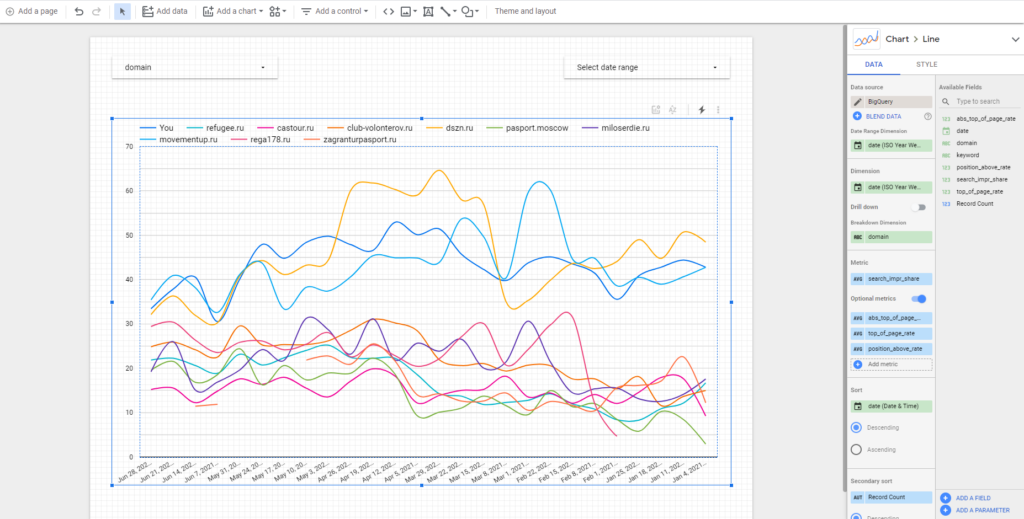
Удобнее всего использовать комбинацию сглаженного графика и еженедельного вывода данных.
Кроме того, вы можете легко создать отчет в формате «конкуренты по ключам»:
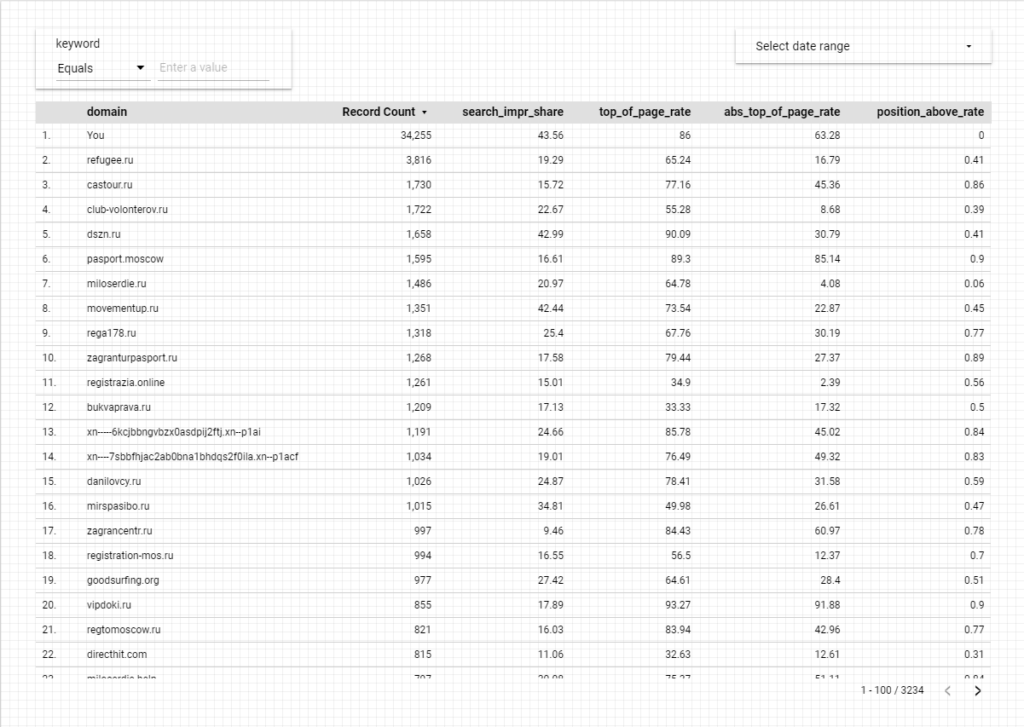
С помощью которого вы можете получить четкое представление о конкуренции по ключевому слову (или всем фразам, в которых встречается это слово) за интересующий вас период.
Или отчет «Ключи конкурента», где вы можете увидеть, насколько конкурент вторгся на вашу территорию и как сильно он пытается победить вас:
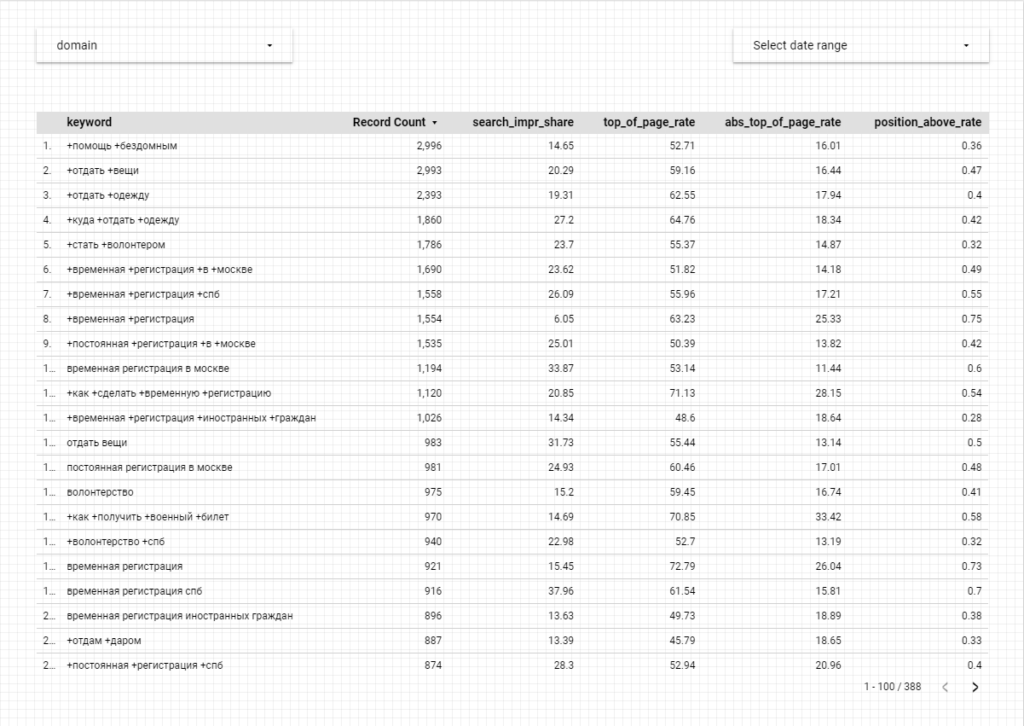
Это, конечно, раскрывает не все семантическое ядро конкурента, а только ту его часть, в которой вы пересекались на своих аукционах. Однако часто вы можете сделать довольно полезные выводы о стратегии размещения ставок на интересующем вас домене, основываясь на составе ключевых слов и их позициях.