Я собирал данные о вакансиях аналитиков около года. Если вы аналитик или просто заинтересованы в этой карьере — вы, вероятно, уже сталкивались с подобными исследованиями. Например, из NewHR или Revealthedata. Те же правила опубликованы для других профессий.
У hh.ru есть API, и по запросу они предоставили мне к нему доступ. Очень любезно с их стороны. Каждый день я собираю свежие вакансии, сохраняю их непосредственно в формате json, а затем загружаю в BigQuery. Я ищу вакансии на основе ключевых запросов, связанных с аналитическими должностями и навыками.
Мне всегда было интересно, почему в этих исследованиях такой акцент делается на заработной плате, но когда я начал разбираться в данных, я понял, что это оправдано. Только четверть работодателей публично объявляют свои зарплаты, и, согласно исследованию NewHR, в основном это вакансии из нижних 2/3 ступеней карьерной лестницы. Поэтому, чтобы у людей была хоть какая-то информация о «ценообразовании» в отрасли, я все же приведу некоторые данные о зарплатах.
Однако моя главная цель — изучить «карьерный рост». Какие навыки требуются? Какие из них более ценятся? В каком порядке мы должны их развивать?
Я попытаюсь описать тенденции, а не конкретные цифры. Собирая данные около года, я имел возможность воочию убедиться, что зарплата, условия труда и требования работодателей вполне способны довольно заметно измениться даже за 6 месяцев.
Классификация
Поскольку не все вакансии со словом «аналитик» в названии попадают в сферу моих интересов, я отфильтровал те, которые мне были неинтересны. Без системных, деловых, финансовых, инвестиционных, рисковых и т.д. аналитиков я закончил с этим списком:
- Инженер по обработке данных
- Специалист по обработке данных
- Инженер ML
- UX analyst
- Аналитик
- Аналитик BI
- Аналитик данных
- Веб-аналитик
- Маркетинговый аналитик
- Аналитик продукта
Из более чем 60 000 вакансий я нашел ~ 27 600 подходящих для исследования.
Это распределение вакансий по профессиям:
| name | Record Count |
|---|---|
| analyst | 15066 |
| data analyst | 3759 |
| marketing analyst | 2715 |
| product analyst | 1538 |
| data scientist | 1514 |
| bi analyst | 958 |
| data engineer | 816 |
| web analyst | 793 |
| ml engineer | 268 |
| ux analyst | 175 |
На этом этапе у меня начала позже развиваться неудовлетворенность публикацией вакансий HR-s — кажется, что не все способны точно классифицировать, кого они ищут.
Анализируя названия вакансий, я наткнулся на тот факт, что во многих вакансиях заголовок содержит классификацию по уровню опыта, примерно такую же, как у разработчиков. В стандартных полях hh такого понятия нет, и я визуализировал взаимосвязь между этим подходом и градацией опыта работы:
| rank.name | Нет опыта | От 1 года до 3 лет | От 3 до 6 лет | Более 6 лет |
|---|---|---|---|---|
| Младший | 58.90% | 39.83% | 1.16% | 0.11% |
| Средний | 13.55% | 61.58% | 23.99% | 0.89% |
| Старший | 7.83% | 43.01% | 46.13% | 3.03% |
| Руководство командой | 8.05% | 24.80% | 54.91% | 12.24% |
| Руководитель | 3.86% | 34.74% | 52.63% | 8.77% |
То есть в среднем у младшего специалиста считается до 1-1, 5 лет специализированного опыта, после чего он становится средним, а через 3 года вы можете претендовать на звание старшего. Вы также можете видеть, что лидеры команд и главы отделов — это не дальнейшее развитие старшего по карьерной лестнице, а отдельные ветви в течение того же периода времени.
Заработная плата
Все зарплаты были сведены к чистым в рублях, а аномальные выбросы были удалены. В «чистом» виде они не так интересны — меня больше интересуют аспекты их формирования:
| Профессия | Минимальная заработная плата | Средняя зарплата »От» | Средняя зарплата «До» | Максимальная зарплата |
|---|---|---|---|---|
| data scientist | 17,000 | 165,416 | 259,541 | 751,680 |
| data scientist | 18,792 | 151,629 | 217,342 | 594,476 |
| ml engineer | 40,000 | 212,477 | 342,544 | 1,080,000 |
| ux analyst | 40,000 | 94,891 | 128,725 | 230,000 |
| аналитик | 5,000 | 62,037 | 82,433 | 720,000 |
| bi analyst | 20,000 | 100,072 | 143,877 | 320,000 |
| data analyst | 13,920 | 96,359 | 127,316 | 450,000 |
| веб-аналитик | 20,000 | 92,141 | 120,721 | 300,000 |
| web analyst | 10,000 | 57,636 | 78,979 | 500,000 |
| product analyst | 13,050 | 122,114 | 170,169 | 350,000 |
Эти данные похожи на «среднюю температуру по больнице». Я думаю, это станет немного понятнее, если вы рассчитаете среднюю зарплату по формуле (От+До)/2 и разделите ее по опыту:
| Профессия ↓ | Нет опыта | От 1 года до 3 лет | от 3 до 6 лет | Более 6 лет |
|---|---|---|---|---|
| data engineer | 103,600 | 205,438 | 273,907 | — |
| data scientist | 126,830 | 157,760 | 225,243 | 232,688 |
| ml engineer | — | 216,696 | 222,613 | 412,938 |
| ux analyst | 85,000 | 92,038 | 165,000 | — |
| analyst | 47,795 | 65,722 | 112,796 | 122,201 |
| bi analyst | 118,289 | 102,268 | 176,538 | — |
| data analyst | 76,417 | 95,341 | 180,097 | 265,000 |
| web analyst | 91,673 | 91,115 | 149,198 | — |
| marketing analyst | 53,084 | 61,867 | 77,033 | 149,686 |
| product analyst | 105,168 | 123,458 | 169,527 | 300,000 |
или по «грейду»:
| Профессия ↓ | Junior | Middle | Senior | Teamlead | Head of |
|---|---|---|---|---|---|
| data engineer | 116,863 | 189,723 | 339,028 | 229,950 | — |
| data scientist | 80,981 | 158,945 | 235,601 | 350,000 | — |
| ml engineer | — | 253,435 | 369,071 | 375,840 | — |
| ux analyst | — | 90,533 | 132,525 | — | — |
| analyst | 43,980 | 68,939 | 94,782 | 139,288 | 121,873 |
| bi analyst | 48,688 | 134,726 | 170,000 | — | — |
| data analyst | 63,538 | 106,332 | 145,260 | 120,000 | — |
| web analyst | 50,244 | 109,797 | 157,500 | — | 150,000 |
| marketing analyst | 34,662 | 63,843 | 88,366 | 140,936 | 157,929 |
| product analyst | 70,000 | 137,075 | 177,117 | 227,517 | — |
Сравнивая две таблицы, мы можем найти несколько выводов:
- руководители отделов редко указывают свою зарплату
- «без опыта» != младший. Я думаю, дело в том, что HR-ы не устанавливают требований к опыту для определенной доли вакансий, и там смешаны старшие классы, что повышает минимальную планку заработной платы.
Навыки
К моему большому сожалению, несмотря на то, что в HH есть функция подсказок в вакансиях для поля навыков, они часто не используются. В результате поля содержат узкоспециализированные термины или даже опечатки.
В общей сложности в изученных вакансиях была указана 5 371 уникальная квалификация.
Можно видеть, что основной »хлеб с маслом» аналитика состоит всего из двух навыков — Python + SQL.
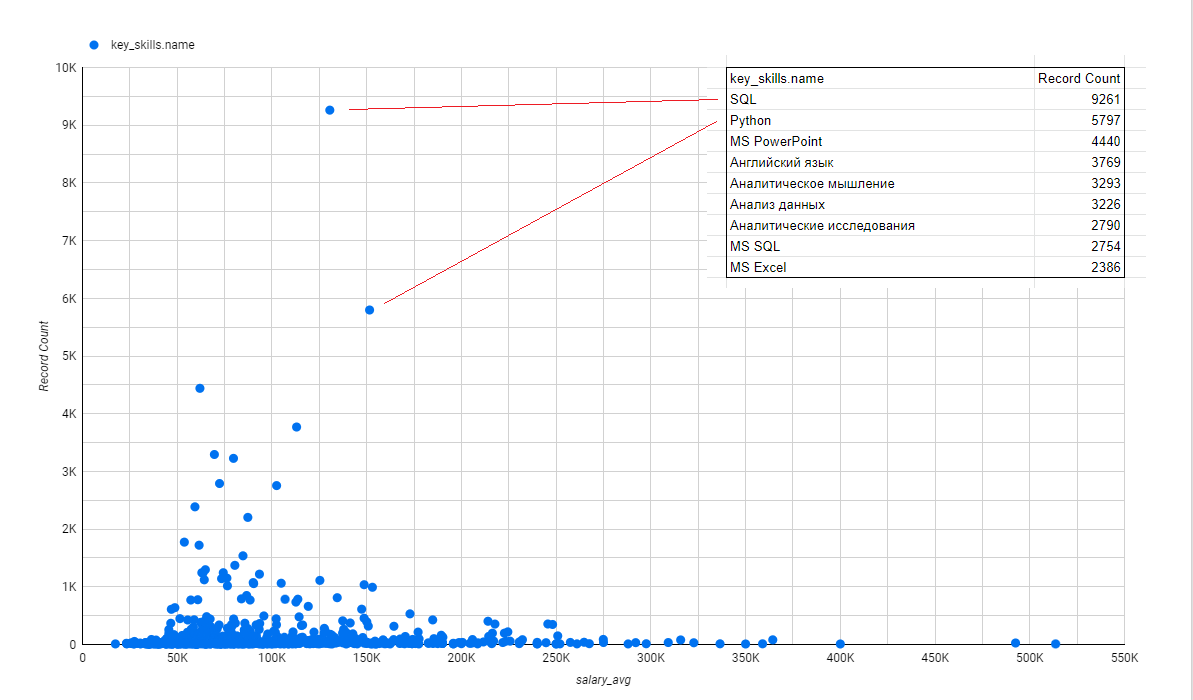
Также в топе — знание офисного пакета, английского языка и требований к «мышлению».
Большие деньги уже есть на гораздо менее популярных (и, следовательно, менее распространенных?)рынках. навыки.
Давайте подробно рассмотрим 200 самых популярных навыков с распределением по степени опыта. Если вы разделите доли должностей по уровням опыта и посмотрите на отклонения от средней доли, станет ясно, какие навыки предпочтительнее для работодателя на каком этапе карьеры. Процент вакансий распределен внутри ряда, но вам нужно сравнить столбцы, чтобы увидеть, какие навыки имеют отклонения от нормального распределения. Я удалил столбец «6 + лет» для удобства.
Вот преобладающие (топ-20 отсортированных) требования к кандидатам без опыта:
| key_skills.name | Нет опыта ↓ | От 1 года до 3 лет | возраст от 3 до 6 лет |
|---|---|---|---|
| Интернет | 63.64% | 33.64% | 2.73% |
| Поиск информации в Интернете | 46.25% | 46.25% | 7.51% |
| Пользователь ПК | 39.27% | 50.95% | 9.78% |
| Хорошие навыки речи | 31.97% | 54.87% | 13.16% |
| Аналитический склад ума | 30.04% | 55.34% | 14.62% |
| Работа в команде | 29.85% | 54.50% | 15.65% |
| Грамотность | 29.38% | 54.98% | 15.64% |
| Командный игрок | 29.35% | 41.30% | 29.35% |
| Деловое общение | 28.82% | 58.82% | 12.35% |
| Статистика | 28.79% | 44.32% | 26.89% |
| Работа с большим объемом информации | 28.26% | 57.95% | 13.79% |
| MS Office | 28.25% | 51.57% | 20.18% |
| MS Outlook | 27.68% | 58.98% | 13.34% |
| Умение работать в команде | 27.37% | 54.74% | 17.89% |
| 1С: Документооборот | 27.36% | 50.00% | 22.64% |
| Ведение бухгалтерского учета | 26.84% | 58.42% | 14.74% |
| Google Docs | 25.77% | 63.80% | 10.43% |
| Деловая переписка | 25.76% | 56.51% | 17.73% |
| Обучение и развитие | 24.66% | 56.05% | 19.28% |
| Ориентация на результат | 24.38% | 58.26% | 17.36% |
От одного до трех лет:
| key_skills.name | Нет опыта | От 1 года до 3 лет ↓ | От 3 до 6 лет |
|---|---|---|---|
| Запрос мощности | 6.96% | 72.15% | 20.89% |
| Проектная документация | 7.87% | 70.87% | 21.26% |
| Аналитические навыки | 12.17% | 70.43% | 17.39% |
| Конкурентная аналитика | 12.59% | 69.93% | 17.48% |
| Sas | 4.03% | 69.35% | 26.61% |
| Планирование ваших маркетинговых кампаний | 5.26% | 69.17% | 25.56% |
| Oracle | 8.31% | 67.95% | 23.74% |
| DAX | 11.43% | 67.62% | 20.95% |
| СУБД | 5.84% | 67.53% | 26.62% |
| Яндекс. Metrica | 8.72% | 66.45% | 24.83% |
| Oracle Pl / SQL | 10.78% | 66.18% | 23.04% |
| Анализ рисков | 8.51% | 65.96% | 25.53% |
| UX | 2.56% | 65.81% | 31.62% |
| Анализ продаж | 18.06% | 65.81% | 16.13% |
| Анализ конкурентной среды | 10.03% | 65.46% | 24.51% |
| Мониторинг рынка | 17.46% | 65.08% | 17.46% |
| Базы данных | 14.68% | 65.08% | 20.24% |
| VBA | 14.18% | 64.81% | 21.01% |
| Аналитика продаж | 13.03% | 64.75% | 22.22% |
| Разработка технических заданий | 9.86% | 64.70% | 25.44% |
От 3 до 6 лет:
| key_skills.name | Нет опыта | От 1 года до 3 лет | От 3 до 6 лет ↓ |
|---|---|---|---|
| PyTorch | 5.18% | 35.23% | 59.59% |
| Бизнес-анализ | 8.38% | 35.08% | 56.54% |
| Составление бюджета | 8.15% | 39.26% | 52.59% |
| Tensorflow | 9.52% | 41.27% | 49.21% |
| Глубокое обучение | 8.33% | 42.71% | 48.96% |
| SCALA | 4.28% | 47.59% | 48.13% |
| Наука о данных | 10.18% | 42.91% | 46.91% |
| База данных: Oracle | 3.52% | 50.00% | 46.48% |
| Управление проектами | 10.42% | 43.23% | 46.35% |
| ОСТАЛЬНОЕ | 4.00% | 50.00% | 46.00% |
| Финансовый анализ | 13.01% | 41.10% | 45.89% |
| Информационная безопасность | 16.45% | 39.47% | 44.08% |
| BigQuery | 2.20% | 53.85% | 43.96% |
| Управление временем | 19.70% | 36.36% | 43.94% |
| Машинное обучение | 11.23% | 45.74% | 43.04% |
| НЛП | 9.02% | 48.87% | 42.11% |
| Docker | 10.67% | 47.33% | 42.00% |
| Развитие продаж | 14.29% | 43.96% | 41.76% |
| Spark | 8.66% | 49.85% | 41.49% |
| Запуск новых продуктов | 5.71% | 52.86% | 41.43% |
Мне кажется, что тенденция перехода спроса от мягких навыков к жестким явно заметна по мере роста опыта. Похоже, что новичков набирают на основе личных качеств, надеясь, что знания будут развиваться в процессе, а опытные сотрудники ищут конкретные задачи.
В моей памяти всплыла запись, недавно опубликованная в одном telegram канале:

Однако иногда определенные навыки все еще могут повлиять на вашу карьеру больше, чем другие. Вот 10 лучших навыков из ~ 500, найденных по крайней мере на 10 вакансиях, отсортированных в порядке убывания средней зарплаты:
| key_skills.name | salary_avg ↓ | Record Count |
|---|---|---|
| Kafka | 364,349 | 17 |
| Google Cloud Platform | 336,508 | 10 |
| Airflow | 315,737 | 33 |
| OpenCV | 309,173 | 12 |
| Kubernetes | 292,000 | 10 |
| Keras | 275,000 | 11 |
| AWS | 274,895 | 32 |
| PyTorch | 250,845 | 40 |
| Spark | 248,126 | 66 |
Как вы можете видеть, вакансий с такими навыками не так много, но вознаграждение выше среднего.
География
Более половины вакансий в отрасли создаются в Москве:
| area.name | Record Count ↓ | salary_avg |
|---|---|---|
| Москва | 56.45% | 111,910 |
| Санкт-Петербург | 11.50% | 95,020 |
| Екатеринбург | 2.96% | 64,282 |
| Новосибирск | 2.85% | 81,887 |
| Казань | 2.23% | 70,891 |
| Нижний Новгород | 2.18% | 72,314 |
| Краснодар | 1.66% | 57,895 |
| Воронеж | 1.40% | 57,086 |
| Самара | 1.05% | 86,626 |
| Ростов-на-Дону | 1.02% | 58,631 |
Также, как и в других исследованиях, я не могу не заметить, что зарплаты в Москве и Санкт-Петербурге выше, чем в среднем по остальной России. Однако отчасти это связано с таким распределением опыта требуемых специалистов:
| area.name | Нет опыта | От 1 года до 3 лет | от 3 до 6 лет | Более 6 лет |
|---|---|---|---|---|
| Москва | 13.92% | 54.94% | 29.34% | 1.80% |
| Санкт-Петербург | 12.28% | 55.64% | 30.53% | 1.54% |
| Екатеринбург | 16.51% | 66.05% | 16.78% | 0.67% |
| Новосибирск | 15.49% | 63.35% | 20.19% | 0.97% |
| Казань | 16.67% | 62.59% | 19.68% | 1.06% |
| Нижний Новгород | 18.26% | 60.76% | 20.43% | 0.54% |
| Краснодар | 11.88% | 69.12% | 18.05% | 0.95% |
| Воронеж | 19.10% | 61.24% | 17.98% | 1.69% |
| Самара | 19.25% | 58.49% | 21.51% | 0.75% |
| Ростов-на-Дону | 21.62% | 59.07% | 18.15% | 1.16% |
Но только частично. Поэтому, если вы хотите выполнять более интересные задачи и получать более высокую зарплату по мере продвижения по карьерной лестнице, вам, вероятно, придется подумать о работе в столичной организации.
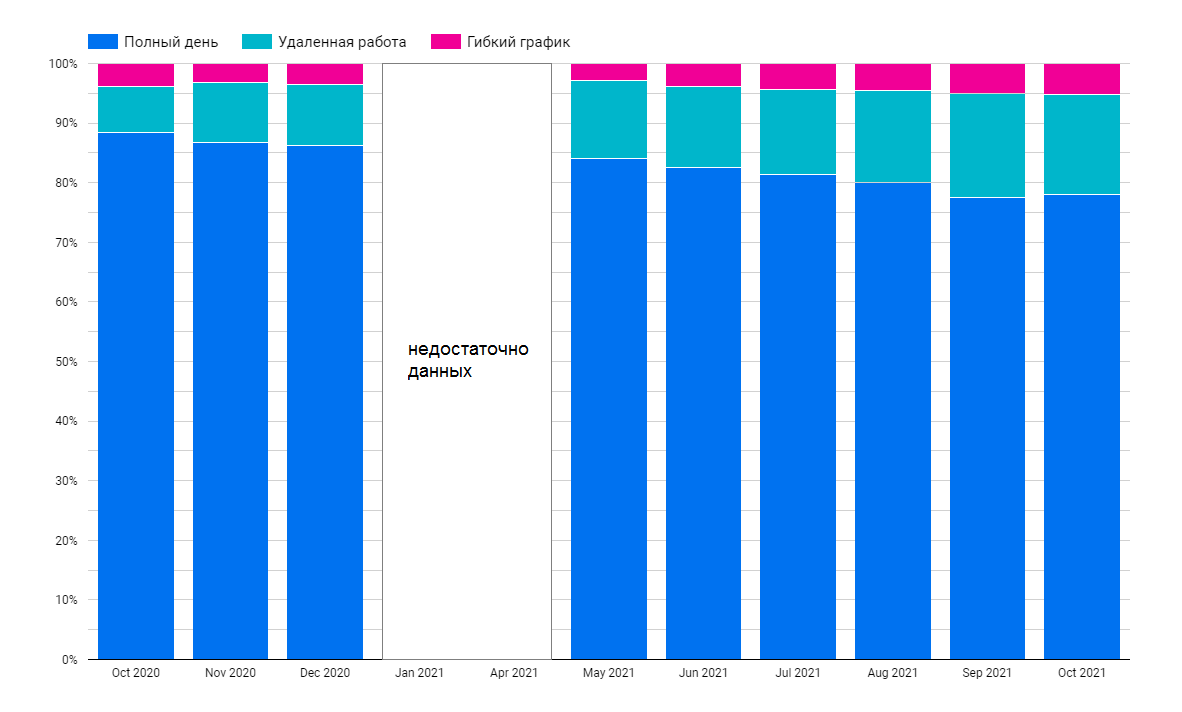
Рабочее время
И есть даже хороший шанс, что вам не нужно будет для этого переезжать — доля работодателей, предлагающих удаленную работу или гибкий график работы, растет. Доля гибкого графика работы увеличилась ~ в два раза за год, а доля удаленной работы увеличилась ~ в три раза.
На данный момент это все.
Чуть позже я планирую объединить эти данные с данными о вакансиях, опубликованных в нескольких специализированных сообществах. Плюс поработать над анализом самого текста вакансии. Есть подозрение, что из неструктурированных текстов будет извлечено больше информации.
 в Google Bigquery")

